Synthetic coronal flow models with predefined preparations parameters
There is a growing need in comparing the performance of the available flow tracking algorithms across a wide range of heliocentric distances not limited by the field of view of previously operated coronagraphs. To address this need, we are designing a set of data-driven numerical models of a dynamic solar corona constrained by previous observations. The models mimics a transient, quasi-periodic plasma outflow mimicking the behavior of the real solar corona. Since the models have predefined sets of flow parameters, they can be used as a benchmark for testing a variety of data analysis methods designed to measure radial velocity and acceleration in the corona, allowing for accuracy and performance comparisons across different flow-tracking codes.
Validating flow tracking algorithms using synthetic flow models such as the ones collected on this page can be instrumental for current and upcoming coronal imaging missions, such as the Polarimeter to Unify the Corona and Heliosphere (PUNCH) mission.
The models are grouped into two categories: 1-dimensional time-evolving models based on synthetic distance-time (DT) plots (Preliminary Challenge) and more sophisticated 2-dimensional time-evolving models generated by the SynCOM code described below (Main Challenge). In either case, the task is to measure the parameters listed below.
TARGET VARIABLES
Determine the following flow parameters for each model:
1) Average radial velocity [km/s]
2) Standard deviation of the velocity [km/s]
3) Average radial acceleration [km/s2]
4) Standard deviation of the acceleration [km/s2]
5) Average period of the disturbances [s]
Please submit your measurement results using our Challenge submission form.
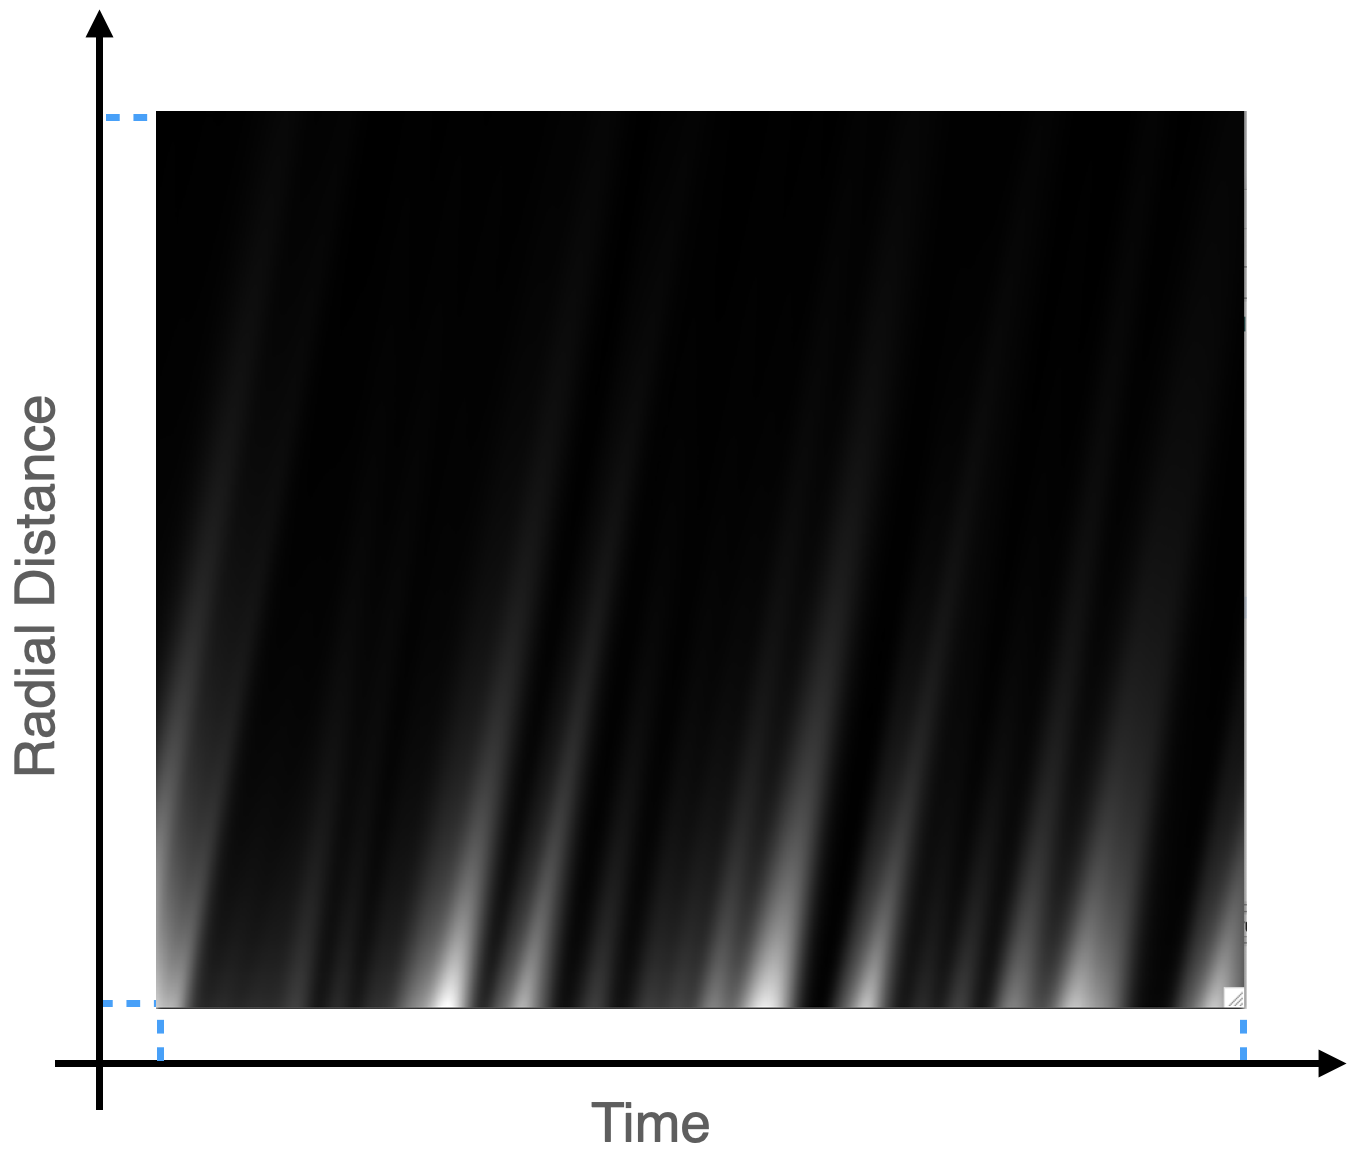
Notations: dt - image cadence, dr - radial pixel size, dθ - position angle pixel size.
Each data set can be downloaded in two formats, FITS or IDL SAVE. The SynCOM-based models have additional options.
PRELIMINARY CHALLENGE
The current section contains synthetic DT plots stored as 2 dimensional FITS and SAV data arrays. Below is an example explaining the coordinate system used.
A warm-up with known propagation parameters
Velocity = 75 km/s, period = 1200 s
dt = 24 s, dr = 435 km

Model 1
dt = 12s, dr = 435 km

Model 2
dt = 12s, dr = 435 km
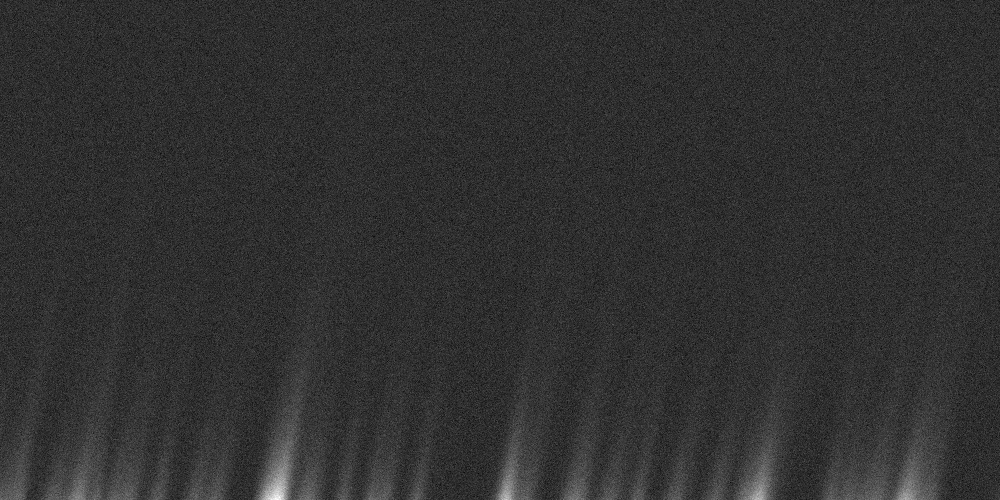
Model 3
dt = 300s, dr = 9744 km

Model 4
dt = 300s, dr = 9744 km
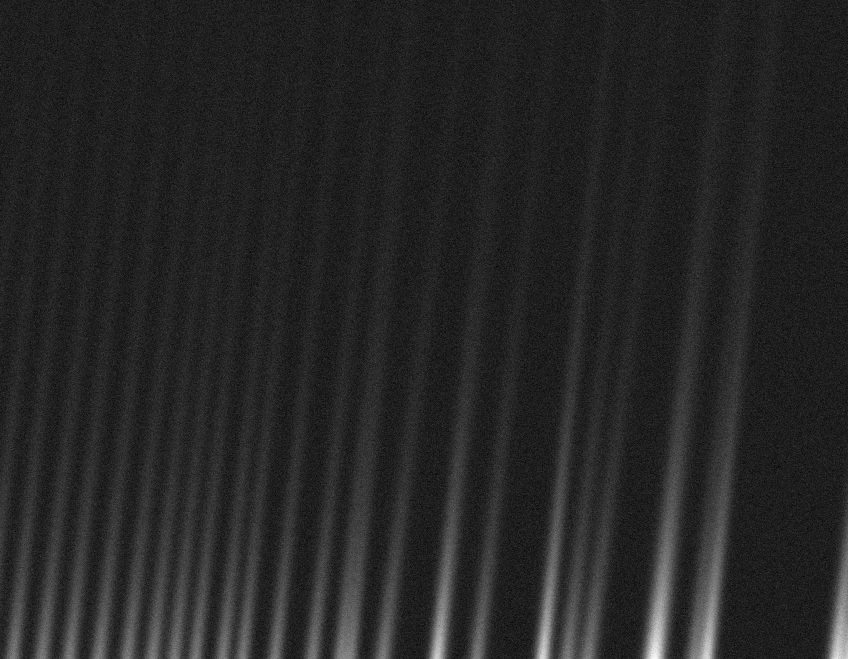
Model 5
dt = 300s, dr = 9744 km
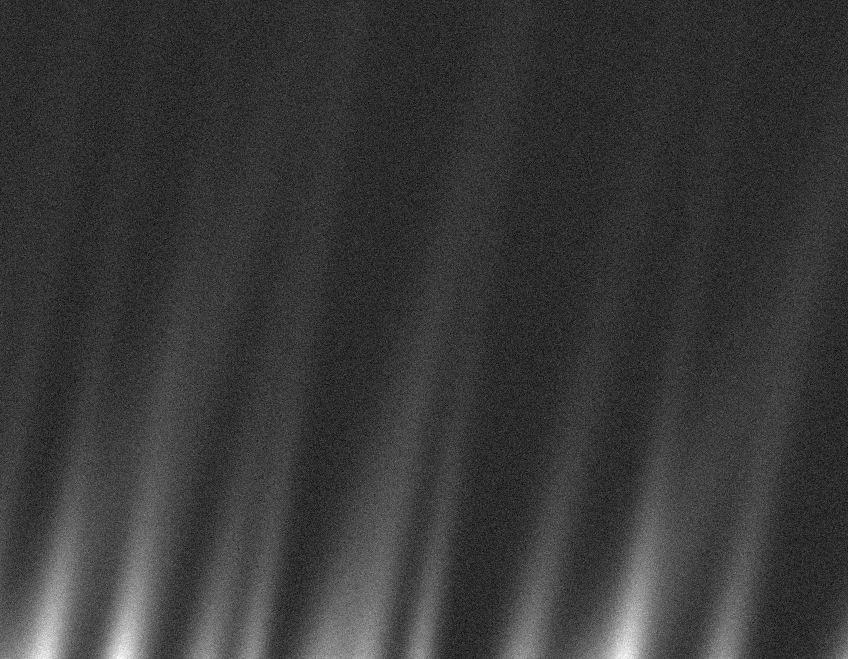
Model 6
dt = 300s, dr = 9744 km

MAIN CHALLENGE
To obtain more accurate coronal flow models, we are designing the SynCOM (Synthetic Corona Outflow Model) code, an empirical data-driven model of a dynamic solar corona constrained by previous high-resolution observations. SynCOM mimics the transient and quasi-periodical behavior present in the actual solar corona. The synthetic images produced exhibit a realistic radial scaling of the polarized brightness and include stochastic components accounting for physical fluctuations of plasma outflow and instrumental noise. The model uses a predefined flow velocity probability distribution and has an adjustable signal-to-noise ratio which can be used for testing the accuracy of flow velocity algorithms under a variety of observing conditions. It may also include radial flow acceleration and other realistic aspects of the coronal outflow.
The SynCOM models provided below are represented by 3D data arrays (FITS and IDL SAVE formats) and also contain video files of the simulated plasma flow. The 3D arrays are stacks of individual image frames sorted by time. They can be used to create DT plots as illustrated below and be analyzed directly.
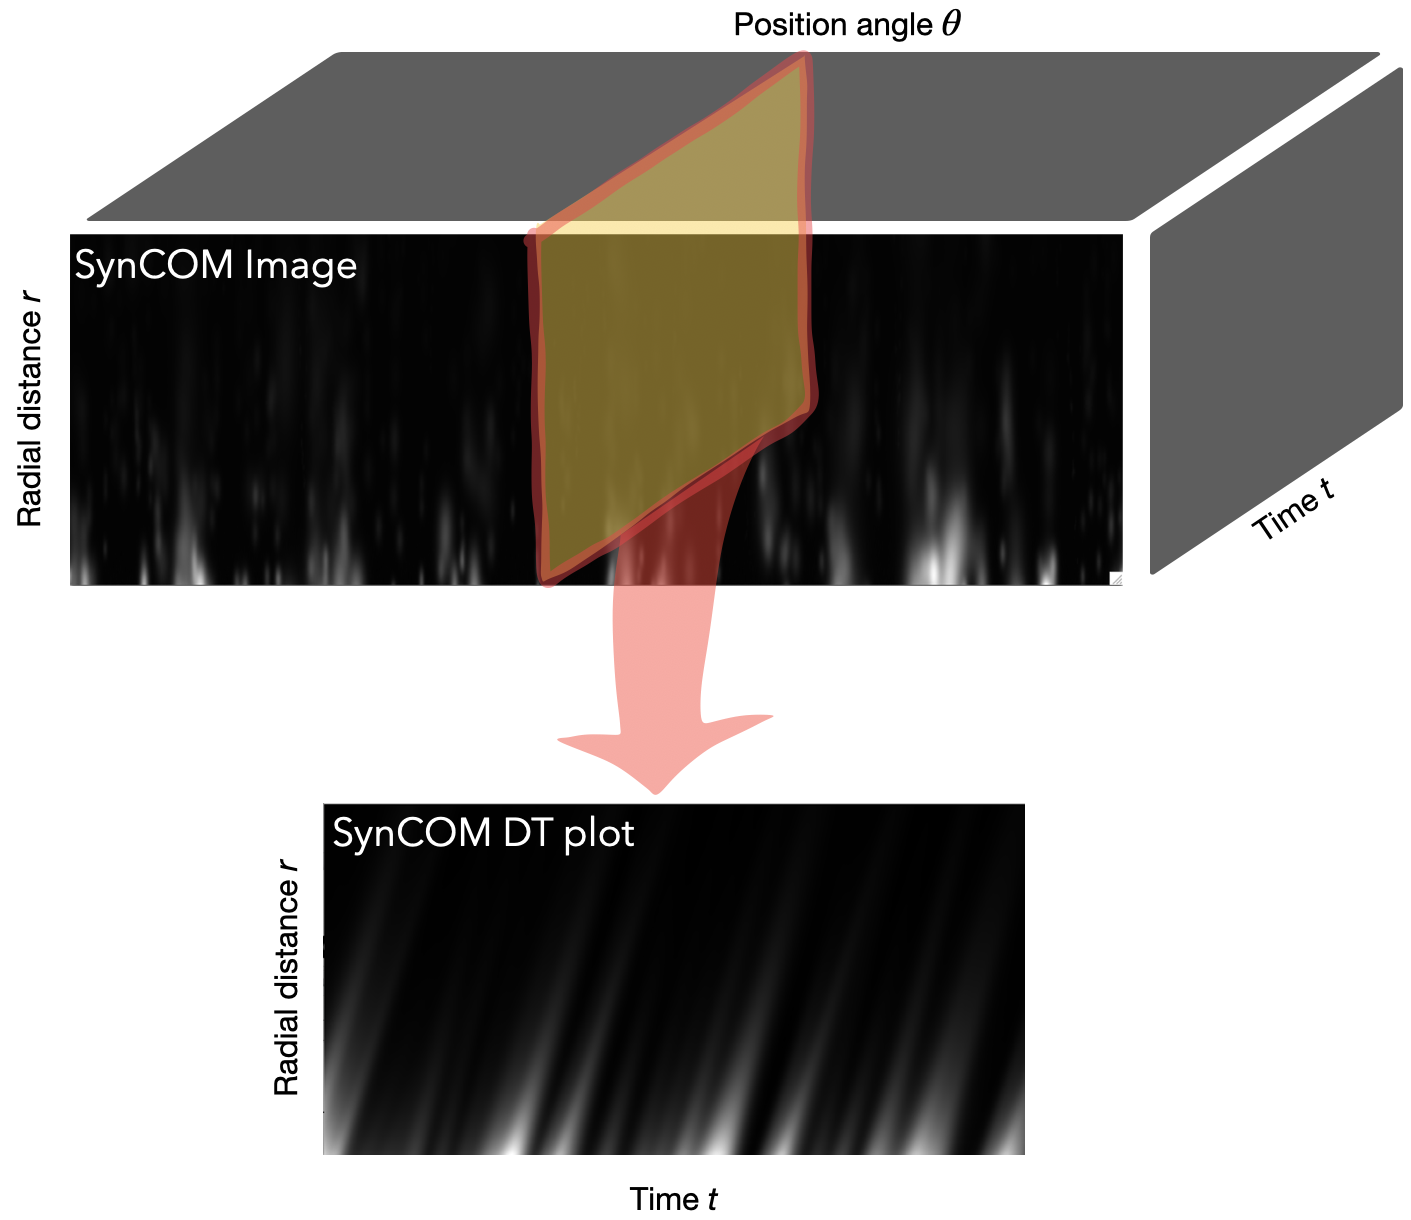
SynCOM 1
dt = 300s, dr = 9744 km, dθ = 0.1 deg
Data set size
Time: 70.8 hours (850 frames)
Radial positions: 4.0 to 15.0 Rs
Position angles: 0 to 360 degrees
FITS FILE IDL SAVE FILE MOVIE FILE
SynCOM 2
dt = 300s, dr = 9744 km, dθ = 0.1 deg
Data set size
Time: 70.8 hours (850 frames)
Radial positions: 4.0 to 15.0 Rs
Position angles: 0 to 360 degrees
FITS FILE IDL SAVE FILE MOVIE FILE
